Week 4: Scientific Computing in Python
This week, you will learn how to do scientific computing in Python. As we learned from first lecture, Numpy is a fundamental package for scientific computing.
The goal of this assignment is to gain comfort creating, visualizating, and computing with numpy array. By the end of the assignment, you should feel comfortable:
- Creating new Numpy arrays using
linspaceandarange - Computing basic formulas with Numpy arrays
- Performing reductions (e.g.
mean,stdon numpy arrays) - Making 1D line plots
Grading:
- Total: 100
- Complete the example code: 20
- Exercise: 26
- Assignment: 44
- Description of AI usage (if any): 10
Using AI in this assignment
For this assignment, do not use AI to write Python for you.
Right now you are learning how NumPy actually works — how an array differs from a list, what broadcasting does to two shapes, why a reduction collapses the axis it does. Those ideas are built by getting stuck and working out why — that is not wasted time, that is the lesson. An assistant that hands you working code removes exactly the practice you need, and the gap shows up later, when the problems are hard enough that you cannot check an answer you do not understand. Later in the semester, once this is automatic, we will use AI deliberately, and some assignments will require it.
What you may use AI for on this assignment:
- Interpreting an error message you do not understand — "what does
ValueError: operands could not be broadcast together with shapes (50,100) (50,)mean?" - Suggesting a debugging strategy — "how can I work out which of my arrays has the wrong shape?"
What you may not use AI for on this assignment:
- Writing, completing, or fixing any code you submit — lecture code, exercises, or the assignment
- Answering the exercise or assignment questions for you
Anything beyond interpreting an error and suggesting how to hunt it down is outside the policy for this assignment.
You must describe your AI usage. It is worth 10 points (see Section 7). For every time you used AI, record which question you were working on, the exact prompt you typed, and what you did with the answer.
If you did not use AI at all, say so in Section 7 — that earns full marks. The points are for an honest, complete account, not for using AI.
1. Importing and Examining a New Package
This will be our first experience with importing a package which is not part of the Python standard library.
import numpy as np
# find out what version we have
np.__version__
'2.0.0'
The numpy documentation is crucial!
2. NDArrays
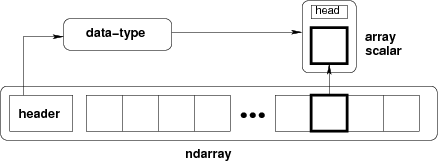
The core class is the numpy ndarray (n-dimensional array). The n-dimensional array object in NumPy is referred to as an ndarray, a multidimensional container of homogeneous items – i.e. all values in the array are the same type and size. These arrays can be one-dimensional (one row or column vector), two-dimensional (m rows x n columns), or three-dimensional (arrays within arrays).
The main difference between a numpy array an a more general data container such as list are the following:
- Numpy arrays can have multiple dimensions (while lists, tuples, etc. only have 1)
- Numpy arrays hold values of the same datatype (e.g.
int,float), whilelistscan contain anything. - Numpy optimizes numerical operations on arrays. Numpy is fast!
from IPython.display import Image
Image(url='http://docs.scipy.org/doc/numpy/_images/threefundamental.png')
2.1 Create array from a list
# create an array from a list
a = np.array([9,0,2,1,0])
# find out the datatype
a.dtype
dtype('int64')
# find out the shape
a.shape
(5,)
# what is the shape
type(a.shape)
tuple
# another array with a different datatype and shape
b = np.array([[5,3,1,9],[9,2,3,0]], dtype=np.float64)
# array with 3 rows x 4 columns
a_2d = np.array([[3,2,0,1],[9,1,8,7],[4,0,1,6]])
a_2d
array([[3, 2, 0, 1],
       [9, 1, 8, 7],
       [4, 0, 1, 6]])
# check dtype and shape
b.dtype
(dtype('float64'), (2, 4))
# check data shape
b.shape
(2, 4)
Important Concept: The fastest varying dimension is the last dimension! The outer level of the hierarchy is the first dimension. (This is called "c-style" indexing)
2.2 Create arrays using functions
# create some uniform arrays
c = np.zeros((9,9))
d = np.ones((3,6,3), dtype=np.complex128)
e = np.full((3,3), np.pi)
e = np.ones_like(c)
f = np.zeros_like(d)
# Random arrays
g = np.random.rand(3,4)
The np.arange() function is used to generate an array with evenly spaced values within a given interval. np.arange() can be used with one, two, or three parameters to specify the start, stop, and step values. If only one value is passed to the function, it will be interpreted as the stop value:
# create some ranges
np.arange(10)
array([0, 1, 2, 3, 4, 5, 6, 7, 8, 9])
# arange is left inclusive, right exclusive
np.arange(2,4,0.25)
array([2. , 2.25, 2.5 , 2.75, 3. , 3.25, 3.5 , 3.75])
Similarly, the np.linspace() function is used to construct an array with evenly spaced numbers over a given interval. However, instead of the step parameter, np.linspace() takes a num parameter to specify the number of samples within the given interval:
# linearly spaced
np.linspace(2,4,20)
array([2.        , 2.10526316, 2.21052632, 2.31578947, 2.42105263,
       2.52631579, 2.63157895, 2.73684211, 2.84210526, 2.94736842,
       3.05263158, 3.15789474, 3.26315789, 3.36842105, 3.47368421,
       3.57894737, 3.68421053, 3.78947368, 3.89473684, 4.        ])
Note that unlike np.arange(), np.linspace() includes the stop value by default (this can be changed by passing endpoint=True). Finally, it should be noted that while we could have used np.arange() to generate the same array in the above example, it is recommended to use np.linspace() when a non-integer step (e.g. 0.25) is desired.
np.linspace(2,4,20, endpoint = False)
array([2. , 2.1, 2.2, 2.3, 2.4, 2.5, 2.6, 2.7, 2.8, 2.9, 3. , 3.1, 3.2,
       3.3, 3.4, 3.5, 3.6, 3.7, 3.8, 3.9])
Exercise 1: Create a 1D array ranging from 0 to 100 (including 100) with an interval of 5. (5 points)
2.3 Create two-dimensional grids
x = np.linspace(-4, 4, 9)
x
array([-4., -3., -2., -1., 0., 1., 2., 3., 4.])
y = np.linspace(-5, 5, 11)
y
array([-5., -4., -3., -2., -1., 0., 1., 2., 3., 4., 5.])
#If you want every combination of (x, y) pairs, meshgrid helps you build two 2D arrays that represent these combinations.

x_2d, y_2d = np.meshgrid(x, y)
# x_2d repeats the x array across rows.
x_2d
array([[-4., -3., -2., -1.,  0.,  1.,  2.,  3.,  4.],
       [-4., -3., -2., -1.,  0.,  1.,  2.,  3.,  4.],
       [-4., -3., -2., -1.,  0.,  1.,  2.,  3.,  4.],
       [-4., -3., -2., -1.,  0.,  1.,  2.,  3.,  4.],
       [-4., -3., -2., -1.,  0.,  1.,  2.,  3.,  4.],
       [-4., -3., -2., -1.,  0.,  1.,  2.,  3.,  4.],
       [-4., -3., -2., -1.,  0.,  1.,  2.,  3.,  4.],
       [-4., -3., -2., -1.,  0.,  1.,  2.,  3.,  4.],
       [-4., -3., -2., -1.,  0.,  1.,  2.,  3.,  4.],
       [-4., -3., -2., -1.,  0.,  1.,  2.,  3.,  4.],
       [-4., -3., -2., -1.,  0.,  1.,  2.,  3.,  4.]])
# y_2d repeats the y array across columns.
y_2d
array([[-5., -5., -5., -5., -5., -5., -5., -5., -5.],
       [-4., -4., -4., -4., -4., -4., -4., -4., -4.],
       [-3., -3., -3., -3., -3., -3., -3., -3., -3.],
       [-2., -2., -2., -2., -2., -2., -2., -2., -2.],
       [-1., -1., -1., -1., -1., -1., -1., -1., -1.],
       [ 0.,  0.,  0.,  0.,  0.,  0.,  0.,  0.,  0.],
       [ 1.,  1.,  1.,  1.,  1.,  1.,  1.,  1.,  1.],
       [ 2.,  2.,  2.,  2.,  2.,  2.,  2.,  2.,  2.],
       [ 3.,  3.,  3.,  3.,  3.,  3.,  3.,  3.,  3.],
       [ 4.,  4.,  4.,  4.,  4.,  4.,  4.,  4.,  4.],
       [ 5.,  5.,  5.,  5.,  5.,  5.,  5.,  5.,  5.]])
# You can now evaluate a function on this grid easily:

z_2d = x_2d + y_2d
z_2d
array([[-9., -8., -7., -6., -5., -4., -3., -2., -1.],
       [-8., -7., -6., -5., -4., -3., -2., -1.,  0.],
       [-7., -6., -5., -4., -3., -2., -1.,  0.,  1.],
       [-6., -5., -4., -3., -2., -1.,  0.,  1.,  2.],
       [-5., -4., -3., -2., -1.,  0.,  1.,  2.,  3.],
       [-4., -3., -2., -1.,  0.,  1.,  2.,  3.,  4.],
       [-3., -2., -1.,  0.,  1.,  2.,  3.,  4.,  5.],
       [-2., -1.,  0.,  1.,  2.,  3.,  4.,  5.,  6.],
       [-1.,  0.,  1.,  2.,  3.,  4.,  5.,  6.,  7.],
       [ 0.,  1.,  2.,  3.,  4.,  5.,  6.,  7.,  8.],
       [ 1.,  2.,  3.,  4.,  5.,  6.,  7.,  8.,  9.]])
Exercise 2 (10 points):
You are given two one-dimensional arrays:
xcontains 5 values evenly spaced between –2 and 2.ycontains 3 values evenly spaced between –1 and 1.
Write a Python program that does the following:
- Use
numpy.meshgridto create two 2D arraysXandYfromxandy. - Compute a new 2D array
Zdefined as ( Z = X^2 + Y^2 ). - Print the shapes of
X,Y, andZ. - In a code comment, briefly explain what the values in
Zrepresent in terms ofXandY.
3. Indexing in Numpy
Indexing in NumPy allows you to access and modify elements, rows, columns, or subarrays of an array. Basic indexing is similar to lists.
# get some individual elements of xx
x_2d[0,0], x_2d[-1,-1], x_2d[3,-5]
(np.float64(-4.0), np.float64(4.0), np.float64(0.0))
# get some whole rows and columns
x_2d[0].shape, x_2d[:,-1].shape
((9,), (11,))
# get some ranges
x_2d[3:10,3:5].shape
(7, 2)
There are many advanced ways to index arrays. You can read about them in the manual. Here is one example.
# use a boolean array as an index
idx = x_2d<0
x_2d[idx].shape
(44,)
Exercise 3: Get the last two columns of y_2d array. (5 points)
# two dimensional grids
x = np.linspace(-2*np.pi, 2*np.pi, 100)
y = np.linspace(-np.pi, np.pi, 50)
xx, yy = np.meshgrid(x, y)
xx.shape, yy.shape
((50, 100), (50, 100))
f = np.sin(xx) * np.cos(0.5*yy)
Visualizing Arrays with Matplotlib
It can be hard to work with big arrays without actually seeing anything with our eyes! We will now bring in Matplotib to start visualizating these arrays. For now we will just skim the surface of Matplotlib. Much more depth will be provided in future lectures.
from matplotlib import pyplot as plt
plt.pcolormesh(f)
<matplotlib.collections.QuadMesh at 0x10eb71bb0>

4.2 Manipulating array dimensions
# transpose
plt.pcolormesh(f.T)
<matplotlib.collections.QuadMesh at 0x10ec778b0>

f.shape
(50, 100)
np.tile(f,(6,1)).shape
(300, 100)
# tile an array
plt.pcolormesh(np.tile(f,(6,1)))
<matplotlib.collections.QuadMesh at 0x10ecdaf70>

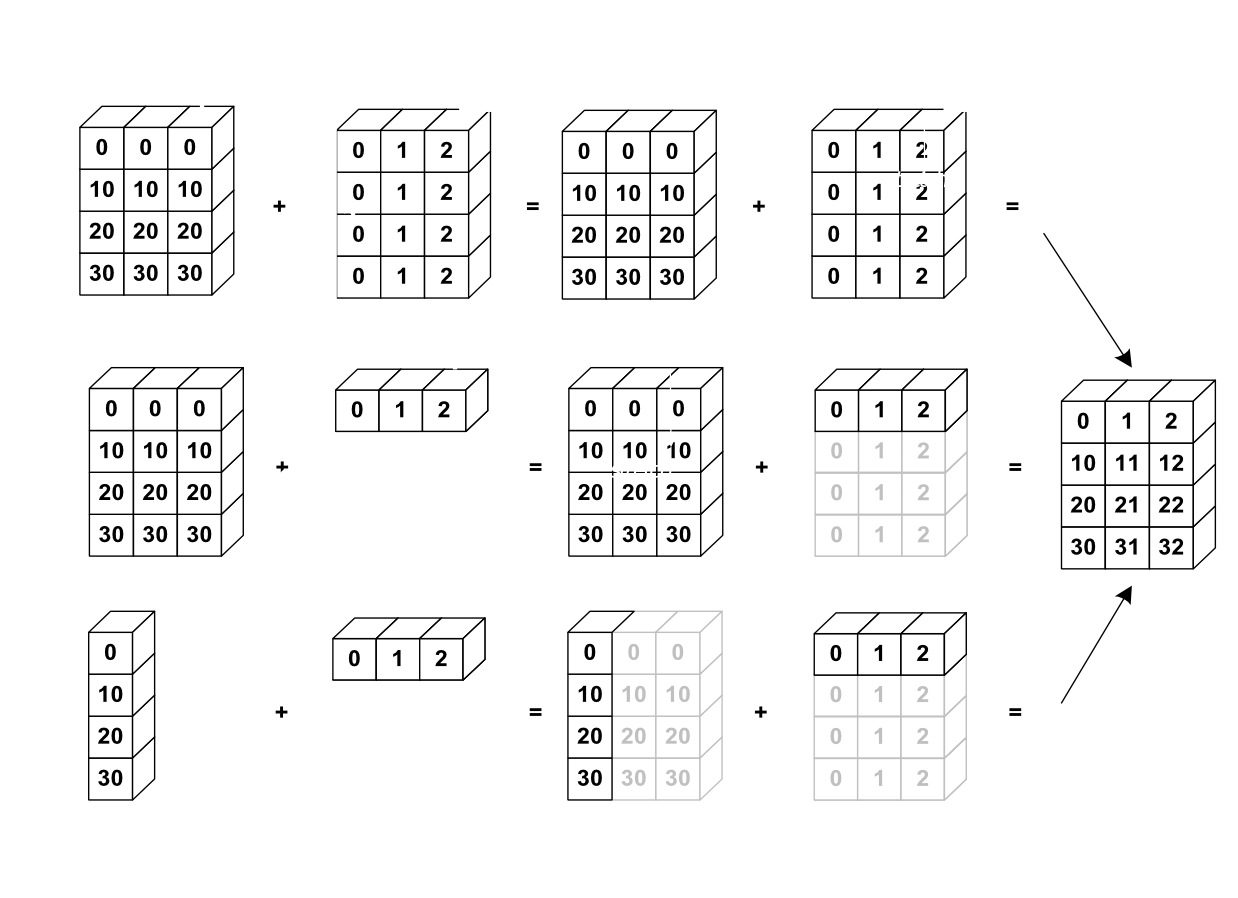
4.3 Broadcasting
Broadcasting is an efficient way to multiply arrays of different sizes
from IPython.display import Image
Image(url='http://scipy-lectures.github.io/_images/numpy_broadcasting.png',
     width=720)
# multiply f by x
print(f.shape, x.shape)
g = f * x
print(g.shape)
(50, 100) (100,)
(50, 100)
# multiply f by y
print(f.shape, y.shape)
h = f * y
print(h.shape)
(50, 100) (50,)
---------------------------------------------------------------------------
ValueError                                Traceback (most recent call last)
Cell In[48], line 3
      1 # multiply f by y
      2 print(f.shape, y.shape)
----> 3 h = f * y
      4 print(h.shape)

ValueError: operands could not be broadcast together with shapes (50,100) (50,)
# use newaxis special syntax
y_new = y[:,np.newaxis]
h = f * y_new
print(h.shape)
(50, 100)
Exercise 4: What is the difference between y and y_new? Why f * y gives an error, but f * y_new doesn't? (3 points)
4.4 Reduction Operations
# sum
g.sum()
np.float64(-3083.038387807155)
# mean
g.mean()
np.float64(-0.616607677561431)
# std
g.std()
np.float64(1.6402280119141424)
# apply on just one axis

# Mean of each row (calculated across columns)
g_xmean = g.mean(axis=1)

# Mean of each column (calculated across rows)

g_ymean = g.mean(axis=0)
plt.plot(x, g_ymean)
[<matplotlib.lines.Line2D at 0x10ee70a00>]

plt.plot(g_xmean, y)
[<matplotlib.lines.Line2D at 0x10eedabe0>]

5. Missing data
Most real-world datasets – environmental or otherwise – have data gaps. Data can be missing for any number of reasons, including observations not being recorded or data corruption. While a cell corresponding to a data gap may just be left blank in a spreadsheet, when imported into Python, there must be some way to handle "blank" or missing values.
Missing data should not be replaced with zeros, as 0 can be a valid value for many datasets, (e.g. temperature, precipitation, etc.). Instead, the convention is to fill all missing data with the constant NaN. NaN stands for "Not a Number" and is implemented in NumPy as np.nan.
NaNs are handled differently by different packages. In NumPy, all computations involving NaN values will return nan:
data = np.array([[2.,np.nan,1.89],
                 [1.1, 0.0, np.nan],
                 [3.2, 0.74, 2.1]])
#Count missing values
missing_count = np.isnan(data).sum()
print(missing_count)
2
# Mean np.mean returns nan if there’s any nan in the data, because the missing value contaminates the calculation.
np.mean(data)
np.float64(nan)
# Use nanmean function to ignore missing values:
np.nanmean(data)
np.float64(1.71625)
# Remove missing values:
clean_data = data[~np.isnan(data)]
clean_data
array([2. , 1.89, 1.1 , 0. , 3.2 , 0.74, 2.1 ])
Exercise 5: Create a new array that replace missing values in data with mean. (3 points)
6. Assignment
6.1. Create two 2D arrays representing coordinates x, y. Both should cover the range (-2, 2) and have 100 points in each direction. (3 points)
Hint: use the meshgrid function
6.2. Visualize each 2D array using pcolormesh (3 points)
Use the correct coordiantes for the x and y axes.
6.3 From your cartesian coordinates, create polar coordinates $r$ and $\varphi$ (4 points):
$r = \sqrt{x^2 + y^2}$
$\varphi = atan2(y,x)$
You will need to use numpy's arctan2 function. Read its documentation.
6.4. Visualize $r$ and $\varphi$ on the 2D $x$ / $y$ plane using pcolormesh (4 points)
6.5 Caclulate the quanity $f = \cos^2(4r) + \sin^2(4\varphi)$ (4 points)
6.6 Plot f on the $x$ / $y$ plane (3 points)
6.7 Plot the mean of f with respect to the x axis, as a function of y (3 points)
6.8 Plot the mean of f with respect to the y axis, as a function of x (3 points)
6.9 Plot the mean of $f$ with respect to $r$ (5 points)
Hint: You will need to define a discrete range of $r$ values and then figure out how to average $f$ within the bins defined by your $r$ grid. There are many different ways to accomplish this.
6.10 Develop a mini tutorial on three NumPy functions (4x3 points)
NumPy is far larger than what we covered in class. Its reference manual is organised by category, browse these:
| Category | Page |
|---|---|
| Mathematical functions | https://numpy.org/doc/stable/reference/routines.math.html |
| Statistics | https://numpy.org/doc/stable/reference/routines.statistics.html |
| Sorting, searching, and counting | https://numpy.org/doc/stable/reference/routines.sort.html |
| Linear algebra | https://numpy.org/doc/stable/reference/routines.linalg.html |
| Logic functions | https://numpy.org/doc/stable/reference/routines.logic.html |
The full index of every routine is at https://numpy.org/doc/stable/reference/routines.html.
Find three functions that could be useful in your own work or research, and write a short tutorial for each — good enough that a classmate who has never seen the function could pick it up from your cells alone.
For each of your three functions, give:
- What it does, in your own words, in a sentence or two. Not a copy of the docstring.
- Why you picked it — one sentence connecting it to your own work, your research interest, or a dataset you care about.
- Working example code — a small runnable example using data you make up. Keep the arrays small enough that a reader can check the answer by eye.
- What the output means — read the result back in words, with units if your example has any.
Rules
- Choose three functions we did not already use in this notebook.
- Your three may not all come from the same page. Use at least two different categories.
- Your examples must actually run here.
- Read the documentation pages themselves. Getting comfortable finding things in the official docs is the real point of this question, and that skill will outlast everything else in this course.
Function 1:
Function 2:
Function 3:
7. AI Usage Description (10 points)
Describe every use you made of an AI assistant while working on this notebook. Remember the policy at the top: error messages and debugging strategy only.
For each use, give three things:
| Where | The exact prompt you typed | What you did with the answer |
|---|---|---|
| Exercise 4 | "what does ValueError: operands could not be broadcast together with shapes (50,100) (50,) mean?" |
It said NumPy lines shapes up from the right, and the trailing dimensions have to match or be 1. I printed f.shape and y.shape, saw (50,100) and (50,), and worked out that y needs a second axis. |
Fill in the cell below with your own table. Two rules:
- Quote the prompt exactly. Paraphrasing it defeats the purpose.
- If you did not use AI at all, write "I did not use AI on this assignment." That is worth full marks. These points are for an honest and complete account, not for using AI.